Device Care Setting
The Settings section enables you to customize and manage alerting and reporting for a specific site.
Make sure you have Studio version 3.3.1 or later to access the full feature set in Device Care.
Device Care Metrics Overview
Device Care monitors several metrics. The table below provides an overview of each metric along with its description.
| Parameter | Default Threshold | Description | States | Resolution Steps |
|---|---|---|---|---|
| Online Anchors (v2) | Automatic | This metric shows ONLINE / OFFLINE ratio of your anchors. |
| Check if the anchor is powered on and reachable from the RTLS Studio server. |
| Tag Batteries (v2) | None | This metric shows OK / LOW BATTERY ratio of your tags. The actual percentage depends on the type of the tag and its battery → Coin or Li-on/Li-pol. Find more details about batteries on page Tag Battery Value. |
| Locate the tags with low battery status and charge them or replace the battery (depending on the tag type). The tag will then eventually return to CHARGED state. |
| Uptime | Automatic | This metric shows the duration of server uptime, monitoring not only how long the server has been running but also its connectivity with the myRTLS cloud. It enters an ALERTING state if a server restart or a connectivity issue between the myRTLS cloud and RTLS server occurs. |
| Try to find out the cause of this restart to prevent it from happening again |
| Free HDD | < 2 GB | This metric shows the current free space on your hard drive. The default threshold is 2 GB. |
| Delete the unnecessary files on your hard drive (e.g., captures, logs), or get new one with bigger capacity. |
| Service Restarts | Automatic | If there are 1 or more service restarts an alert is sent and it is included in a report. Services included:
| ||
| REST API Latency | > 500ms | This metric shows the average duration of REST API responses from the sever in the last minute. The default threshold is >500ms. | If the API responses are too long (above the threshold) the metric goes into alerting state. | Check the utilization of the server resources. If the latency is high for long period of time, or is getting progressively worse, consult with our CX Team → Open a ticket. |
| WebSocket API Latency | > 500ms | This metric shows the average duration of position calculations in last minute. The duration is measured on the server from receiving anchor messages to receiving the positions via WebSocket (UDP is not supported at the moment). The default threshold is >500ms. | If the position calculation takes too long (above threshold) the metric is set to alerting state. | Check the utilization of the server resources. If the latency is high for long period of time, or is getting progressively worse, consult with our CX Team → Open a ticket. |
System Performance BETA | Automatic | This metric shows the overal system health. It is based on the CPU and RAM usage. |
| Consult the CPU and RAM usage with your system administrator and with our CX Team → Open a ticket. |
Inactive Tags BETA | > 10 minutes | This metric indicates the time elapsed since the last position was calculated for the specified tag. You can set a threshold when an alert will be triggered. The default threshold is >10minutes of inactivity. The threshold should correspond with tag setting used on your site. |
| Look on where the last position for the given tag in Sensmap and search the tag physically to define why the tag is not active. Feel free consult with our CX Team → Open a ticket. |
Successful Synchronization BETA | < 20% | The success rate during RTLS position calculations. When positions are being calculated, the system checks for synchronization. A success occurs when proper synchronization is found, allowing the position calculation to proceed. A failure indicates poor synchronization, preventing the position calculation from being completed. The default threshold is <20%. |
| Check visibility between anchors within the problematic cell. Contact our CX Team → Open a ticket. |
Free RAM | None | This metric shows the current available RAM of your server machine. The threshold is deliberately set to 1GB, because it is the point where you may start encountering some issues with the RTLS Studio. | If you don't have enough free memory, the metric goes to alerting state. | Try killing some heavy usage processes, or upgrade your RAM if necessary. |
CPU Load | None | This metric shows the utilization of the CPU during the last 5 minutes. | If the CPU utilization is above threshold for at least a minute the metric goes to alerting state. This may result in delayed position calculation and may also have other negative effects on the RTLS system. | Check what processes are using the CPU the most and try restarting them. If the CPU load is high for long period of time, or is getting progressively worse, consult with our CX Team → Open a ticket. |
Localization Cell RETIRING | BAD | This metric shows OK / WARNING / BAD ratio of your localization cells. |
| Contact our CX Team → Open a ticket. |
Metric Setting
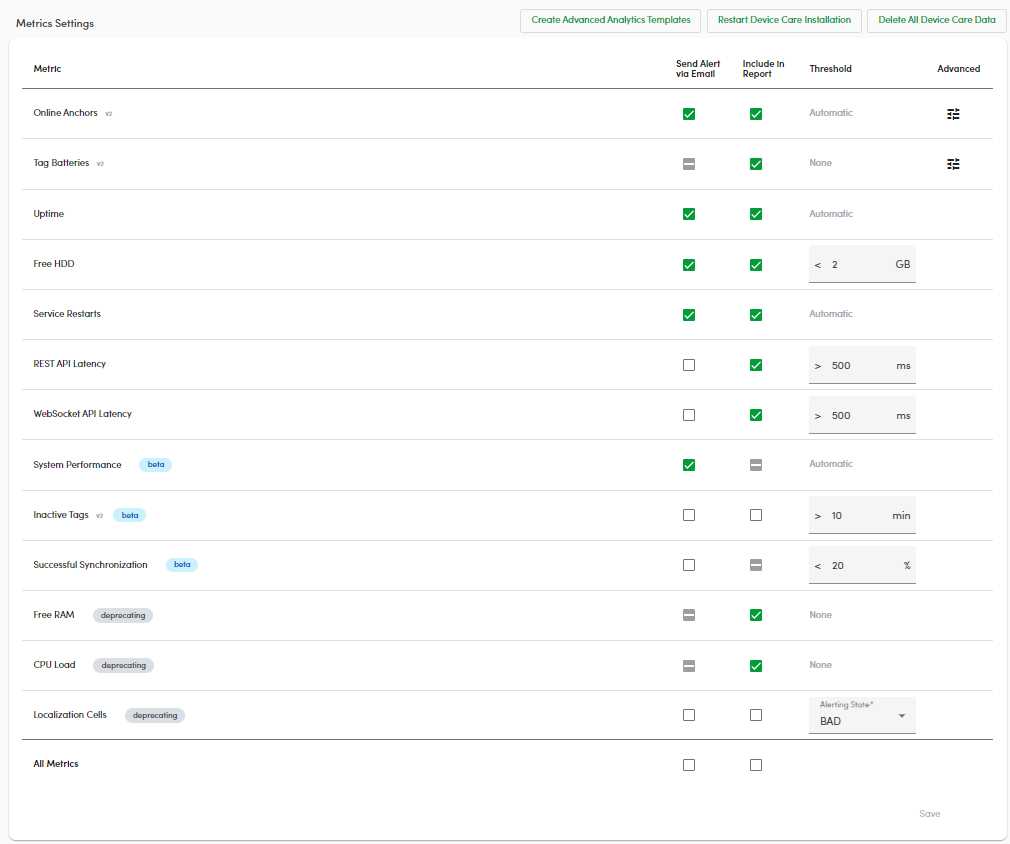
In the Settings section, you can define how you'd like to be informed for each metric. You can customize alerting, and reports. By default, the metric selection is set as shows the picture below.
Advanced Setting
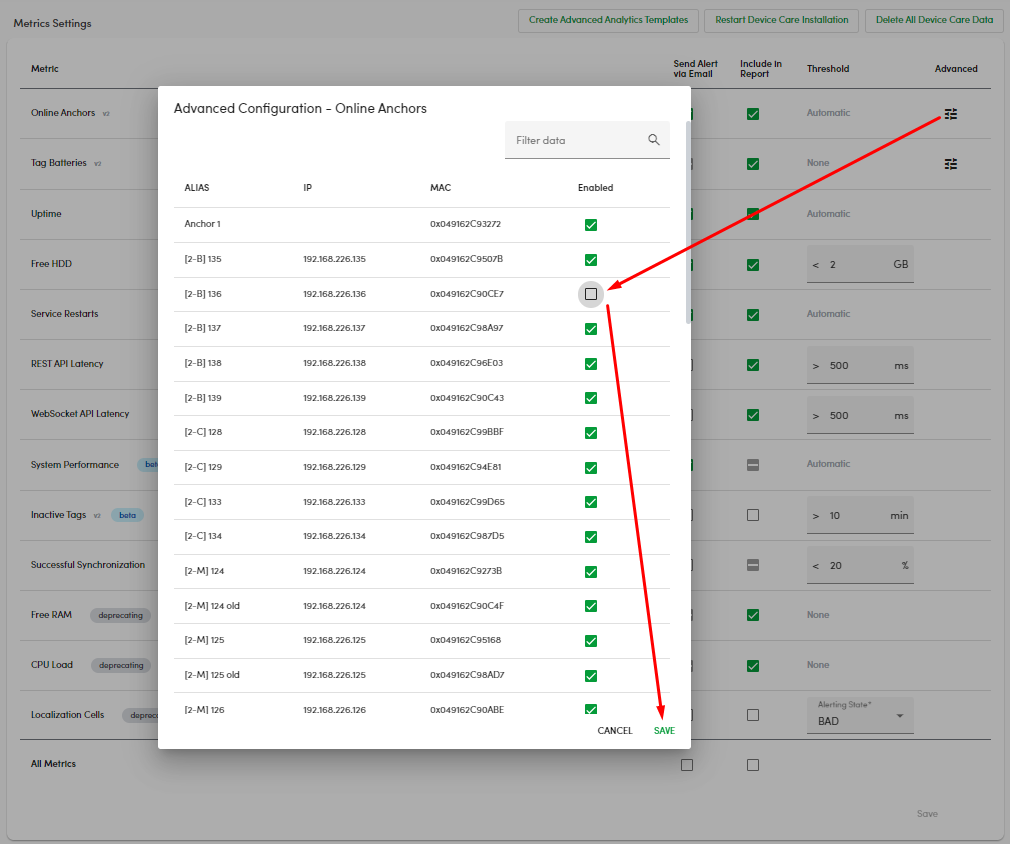
The metrics Offline Anchors and Tag Batteries also have advanced settings. You can go through the list of anchors or tags and exclude specific tag(s) or anchor(s) from monitoring.
Notification Setting
Once you have configured all the metric settings, you can subscribe to receive alerts and reports. Add the email address of each person who should receive alerts and/or reports, based on the metric settings you've defined.
You can also choose to receive reports weekly or monthly. For more details about reports, see the Device Care Reports section.
Device Care Control Options
In the top right corner of the Settings page, you will find three buttons related to Device Care's general settings.
These control buttons enables:
Create Advance Analytics Template
Under this button, you can begin creating a new custom dashboard for Grafana in the Advanced Analytics module.
For more details and step-by-step instructions on how to create a custom dashboard, refer to the page How to Create a Custom Dashboard?
Delete All Device Care Data
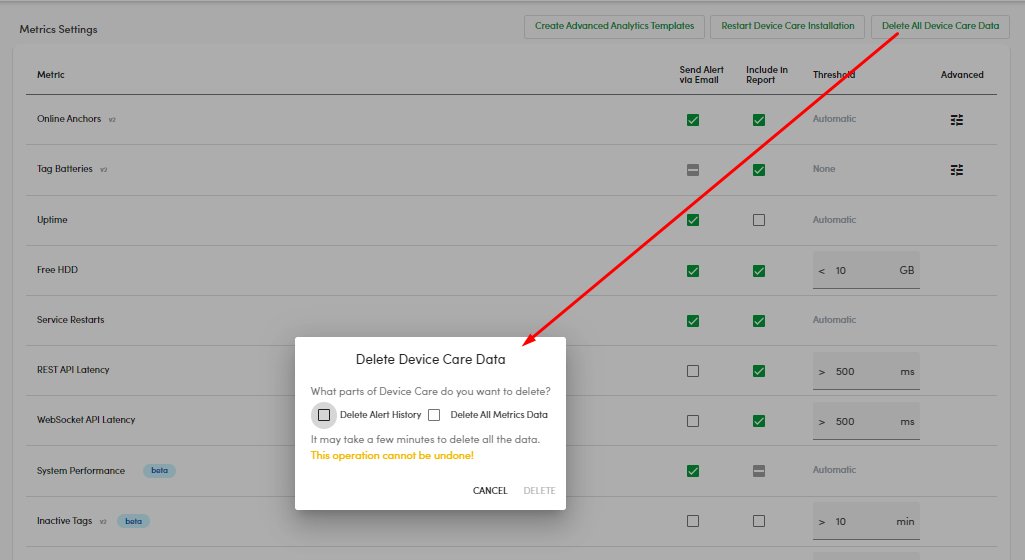
This button lets you clear the entire Device Care database. It's an ideal feature when commissioning ends and you are ready to hand over the system to the customer. You can choose to clear the Alert History and/or All Metric Data.
Please note, there is currently no option to selectively delete specific data. Deleting will result in the complete loss of all data.
Restart Device Care Installation
If you are migrating RTLS Studio to a new server, you can follow all installation steps by clicking the Restart Device Care Installation button.
This button will guide you through the necessary steps and provide you with the Site ID and Site Password. You will be redirected to the Device Care Installation section.


