Device Care Advanced Analytics
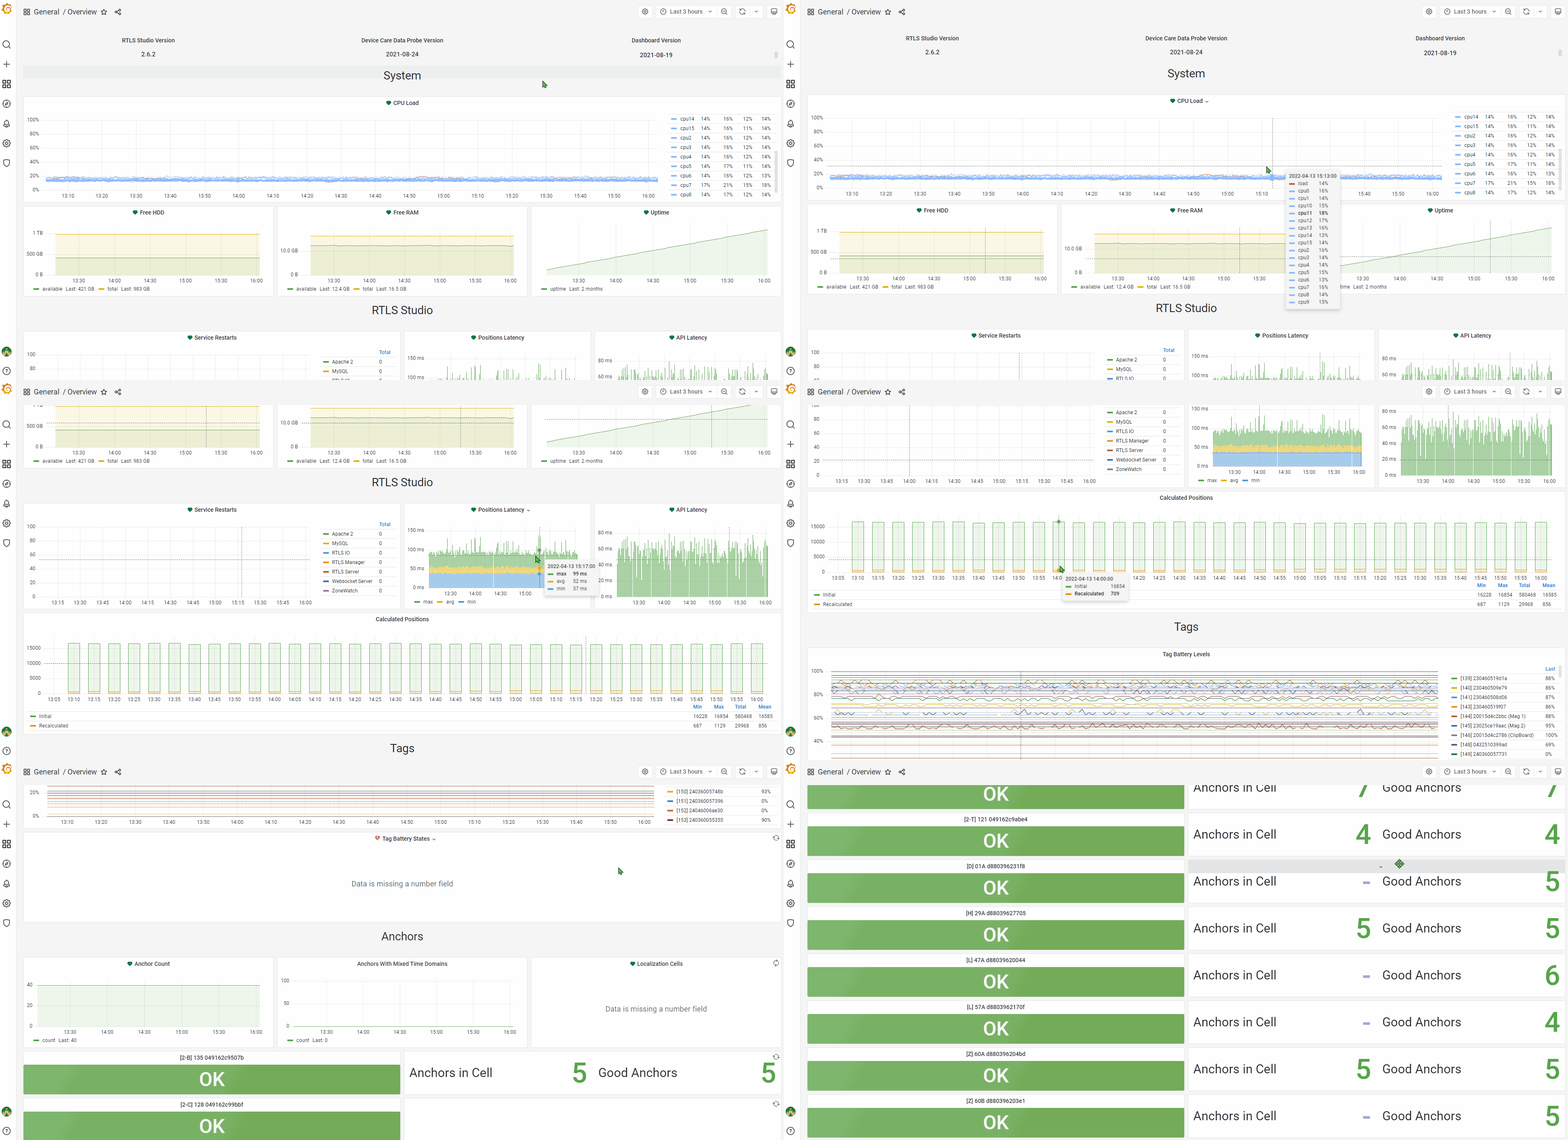
MyRTLS Care provides you an option to see the monitoring data in more detailed way. Under Advanced Analytics section, view the status and analytics of operations in convenient and organized space.
Overview Dashboard
You will be forwarded to the Overview dashboard in Grafana where you can find the complex graphs related to the system, RTLS Studio, tag, and anchors monitoring parameters.
Other Preset Dashboards
We made a few more dashboards ready for you. Through the left panel, select browse dashboards. You can find the list of all dashboards available. It includes Anchor - Details, Anchors - TCP Sync, Anchors - UDP-AD Sync, RTLS Studio - Configuration & Error logs, and the already mentioned Overview dashboard.
Custom Dashboard
If the preset dashboards are not suitable for you, you can create your own. For more details see the page How to Create a Custom Dashboard.
Grafana Alert Notifications
Not only from myRTLS Cloud but also through Grafana you can receive alerts. Integrate myRTLS with your system by e.g. Webhook API to learn about problems in your systems moments after they occur. For more details see page Grafana Alert Notifications.
On this page:


