Demonstration
Your RTLS Kit is successfully deployed. Now, you can show several things to the customer during the demonstration.
Here are the general features:

Tag Tracking
In Sensmap, you can enable tracking and make each calculated position for a given tag visible. Go to the RTLS tab, section Node Tracking Statistics.
Select the tag and start tracking. The position of the given tag is now present in Sensmap. You can define how many positions you would like to display.
![]()
Zones
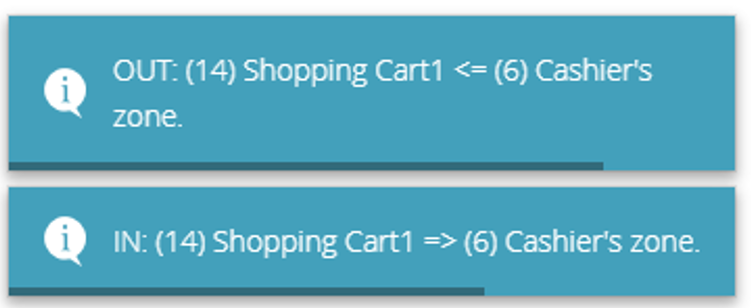
Another feature that's great for demonstrations is Zones. You can create a virtual zone and present site events.
The event is visualized in Sensmap, including the tag name and type of event. Similar information can be sent via the API.
For more details see section Zones.
Tag Zones
RTLS system has also an option to create a zone around a tag. It is called a tag zone. This feature allows you to track when two tags meet or separate. You define the radius. When two anchors meet, it is considered a MEET event. Once they are no longer in contact, a LEAVE event is triggered.
For more details see section Tag Zones.
UWB Backchannel
You can simple demostrate application of the backchannel. RTLS Studio 2.6 and higher includes an application which allows control of the user LED on the tag.
Typical use-case: If someone is looking for one tag that is placed in a big group of tags in a small area - the user can just trigger the LED blink on the particular tag so he finds it instantly.
Find more details about UWB Backchannel configuration on page related to Pick-by-Light Application.
Press Event
Tag Leonardo Personal has a button.
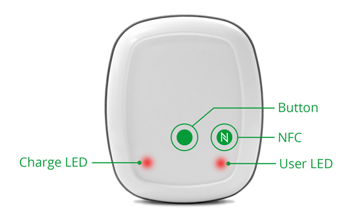
By pressing the button, you can visualize the tag in Sensmap. Also, an event via the API can be set.
Finding a Tag
If a tag position is unknown, you can find the last position of the tag in the Sensmap.
Studio 2.6 brings an option to search in Sensmap and find quickly an anchor or a tag by MAC address or its alias. It is beneficial mainly when a project is about many tags and you need to find a specific tag as fast as possible.
Example
Consider a worker who looks for a missing pallet in a Warehouse. The worker knows from inventory list that the pallet has got a tag with MAC address 0x0020600024A7. Simply type or scan in a barcode and within a second you know the exact place.
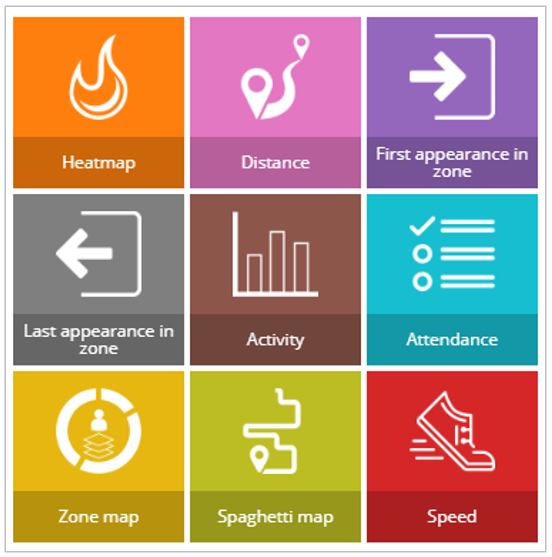
Sage Analytics
The last tool for presenting data during the demonstration is SAGE Analytics. It is a part of RTLS Studio and enables the presenting of positioning data using graphical metrics. The data can be presented as, for example, a heatmap, spaghetti map, etc.
You can find more details in the section SAGE Analytics.
This tool is designed mainly for demonstration purposes.