Sync Stability Review for Troubleshooting
High positioning accuracy requires sub-nanosecond time synchronization.
Stability of synchronization can be reviewed using Synchronization Stability graph which is part of the RTLS Manager. The metrics that can be watched in the graph are 2nd Difference, RSSI, and First Path.
If the chart is not plotted after the selection of master anchor, the reason may be an incorrect network configuration or blocked port 8000 between RTLS Manager and Host PC.
List of required communication ports are described within section Network Architecture and Required Ports.
Sync Stability Key Parameters
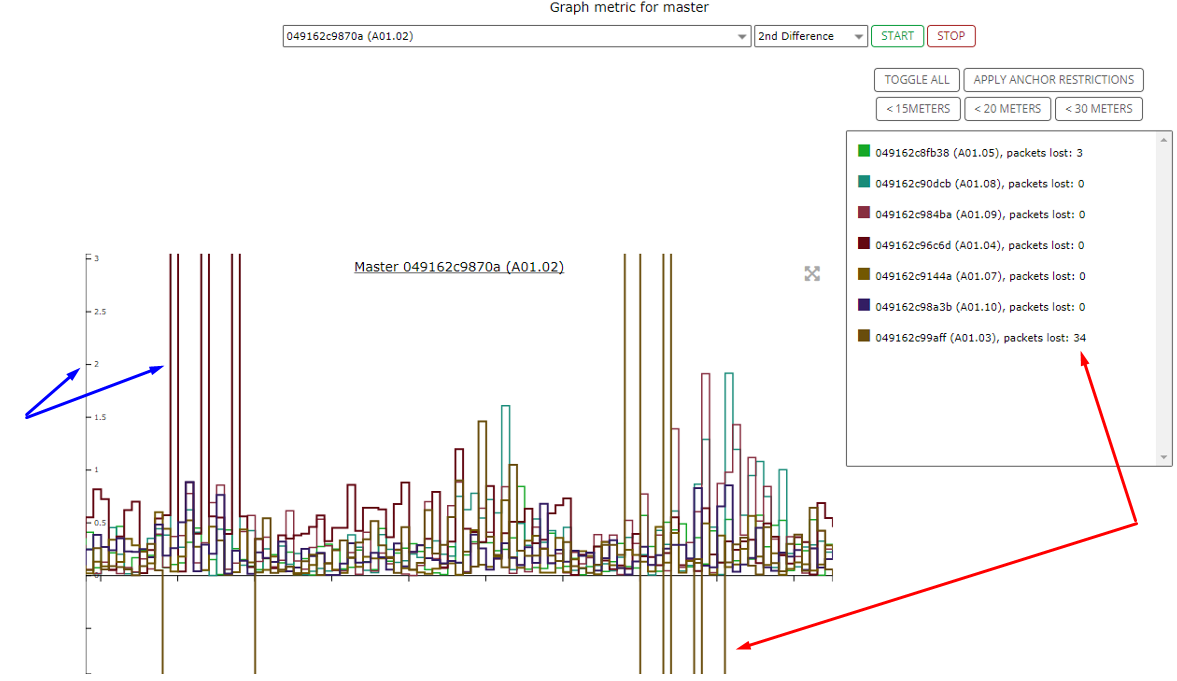
Synchronization between Master Anchor and its neighbors is stable if the 2nd difference does not exceed value 2 and the 2nd Difference is stable over time without significant packet loss.
An Example of the unstable synchronization you can find on the picture below:
- Blue arrows → 2nd difference over value 2
- Red arrows → Packet loss
Debugging
If one of neighbor anchors is missing, you should check whether:
- Anchor is offline
- Anchor have different sync RF profile or channel configuration
- Anchor have different IP address for RTLS Server
When sync stability is above 2 also after warm up time, then:
- Try to rotate anchor a bit (still remember about Anchor Deployment rules)
- Or select different master anchor
If all neighbor anchors have fluctuations behavior then the issue may be caused by the master anchor.
Correlation of RSSI and First Path
This section is for more advanced users - not required for common deployments.
By comparing RSSI and First Path parameters, it is possible to estimate
- Whether the anchors are synchronized through LoS signal
- Or the sync signal is propagated through obstacles, affected by reflection or scattered.
You can find details in the example below.
Practical Example - Sync Stability Check
Let's consider RTLS System deployment in a small factory and focus on one specific area. It is a storage area and consists of two rooms. The wall between the storage rooms is made using gypsum boards.
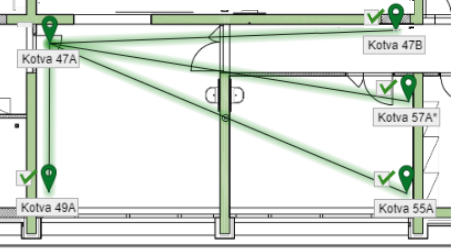
Anchor 47A is selected as the master anchor for the storage area location cell. Anchors 47B, 49A, 55A and 57A are neighbor anchors. Only the anchor 49A has the LOS with the master anchor 47A within the storage area location cell. Other neighbor anchors are located in the next room behind the gypsum board wall.
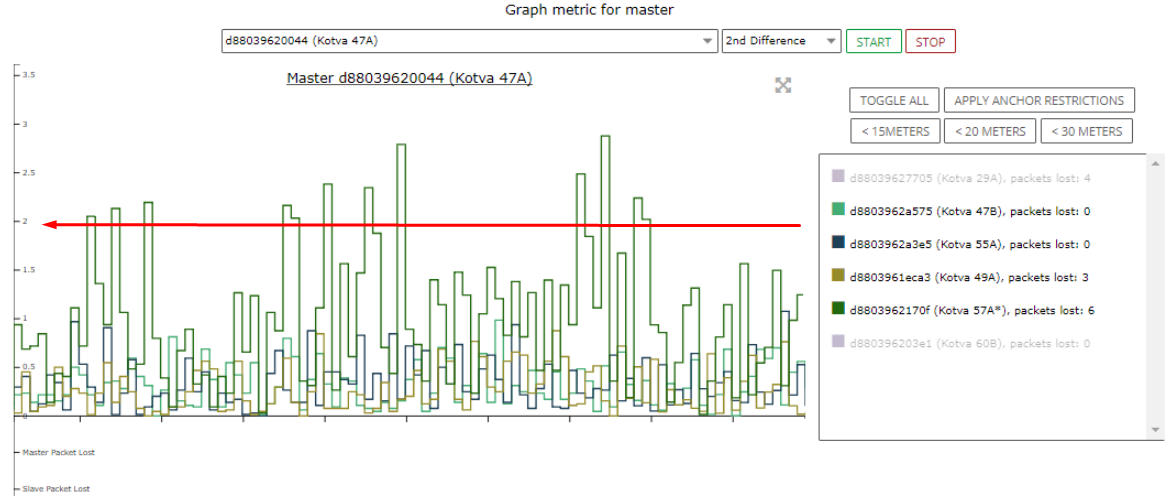
1) The first point of control will focus on the 2nd Difference graph. As you can see on the picture below, synchronization between the master anchor and neighbors 47B, 55A and 49A is stable (values does not exceed 1. But the 2nd Difference for the anchor 57A vary considerably and exceed the threshold value 2.
It is important to realize that implication of this results is, that the data from anchor 57A are often not used to calculate the position.
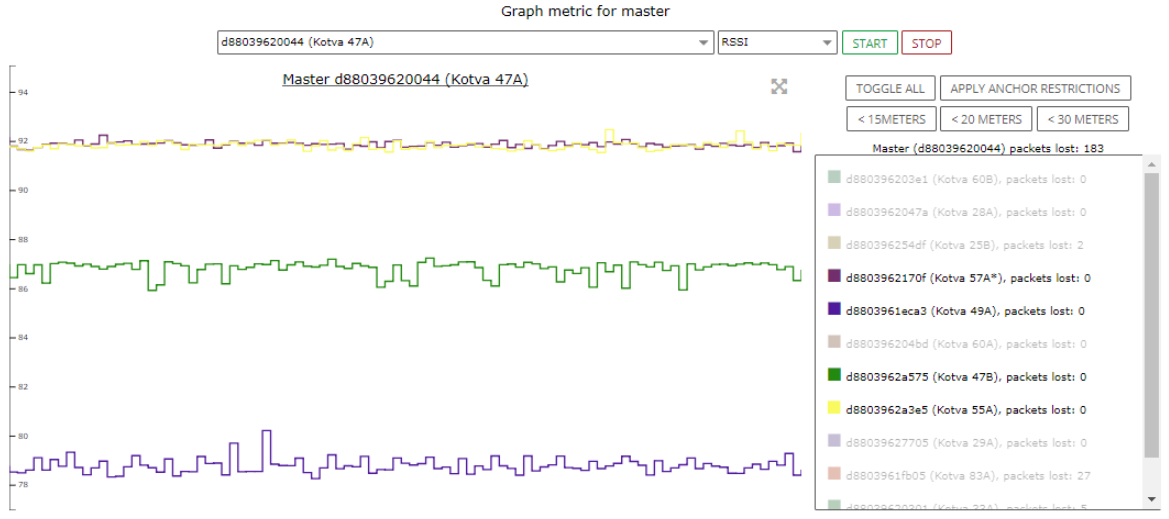
2) The second point of control is output of the RSSI graph. In our example, it shows significant differences in the signal levels.
The result is in line with expectations, because only anchor 49A (violet color) has direct visibility (LOS) with the master anchor. Its RSSI is -79dBm. The other anchors that are part of the storage area location cell are physically separated by the gypsum board wall that causes signal attenuation.
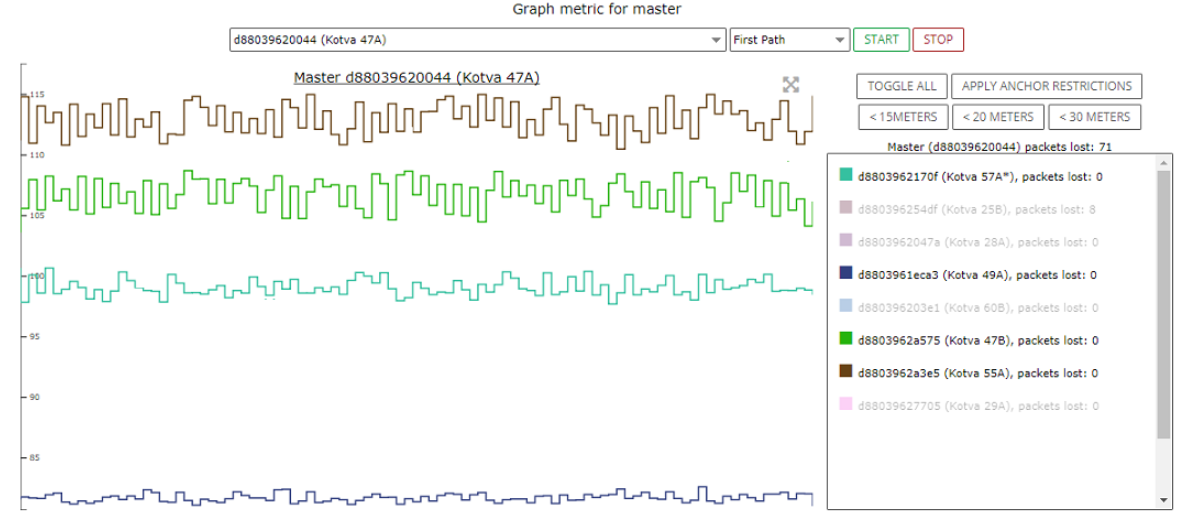
3) The third point of control is the First Path graph.
Despite the fact, the 2nd difference result of anchor 57A is often above the threshold, you can see that the displayed First Part result for the anchor 57A is relatively stable.
Another fact to note is the variation of the First Path values displayed for the anchor 55A and 47B. This variation is caused by the gypsum board wall that is located between the master anchor and neighbor anchors.
The last point that is worth mentioning is the level of values of the First Path parameter for anchor 55A. Values very close to -115dBm threshold level indicates a very poor signal quality for synchronization and this condition has a significant impact on the positioning accuracy.
Correlation of RSSI and First Path
Now, you can compare RSSI and First Path results from the two graphs above. Usually, RSSI has slightly higher values than First Path. The difference is approx. 5dBm.
You can see Good Synchronization stability with LOS when you compare RSSI and First Path of the anchor 49A. The RSSI is -79dBm and First Path is -82dBm in our example.
The opposite is RSSI and First Path comparison of the anchor 55A. The result of RSSI is -92dBm and First Path is -115dB. The difference is 23dBm which indicates poor signal quality and NLOS.
On this page:
