RTLS System performance in RTLS Monitor
RTLS Studio software includes performance monitoring tools – see RTLS Studio main menu → RTLS Monitor. In terms of server performance monitoring, System status and Network are most important tabs.
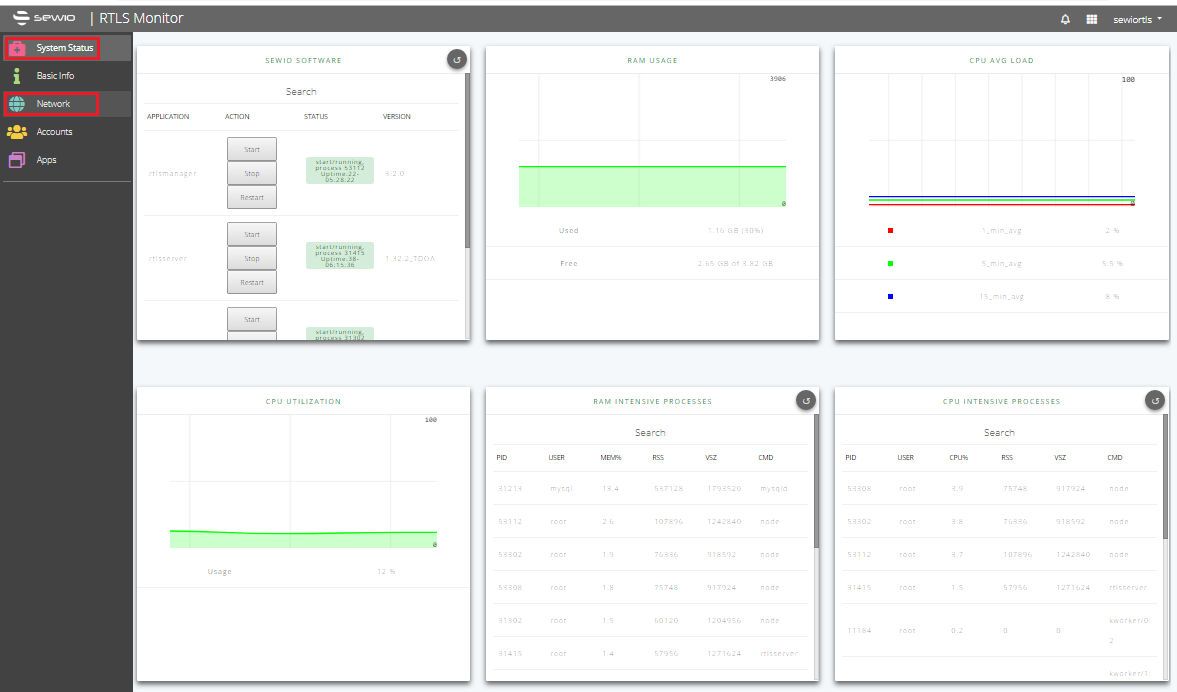
Server performance
- System status tab can easily check usage of the RAM (window RAM USAGE), current CPU utilization (window CPU UTILIZATION) and average CPU load (window CPU AVG LOAD). CPU AVG LOAD window visualizes statistics for three different periods – 1, 5 and 15 minutes.
- Insufficient server performance can be identified by the very high values listed in these monitoring windows. CPU INTENSIVE PROCESSES monitoring window allows you to identify applications that use the large portion of system resources (note: please use a circular icon to refresh/reload data).
- CPU/RAM AVG load should not exceed 95% for longer period of time.
- The network traffic load can be checked using the NETWORK tab. UDP PORTS monitoring window – it provides an overview of the queue size and the number of dropped data frames for a particular port. If the server does not provide the necessary performance, typically number of dropped frames is increased.
- Some drops on UDP Port 5001 (anchor sync reports) are acceptable while drops on UDP Port 5100 (tag blink reports) might cause noticeable positioning outages.
Disk partition
- If main disk partition has less then 2 GB free space - store to DB will be automatically turned off.
- When there is no free space on the main disk partition, Sewio software can not run properly - for more details see section Store To Db in Position Data Output.
Sewio software
- System status tab shows also status of Sewio software and uptime.
- If needed you can restart one of the RTLS Server software component (using "Restart" button in the window SEWIO SOFTWARE).
- If some strange behavior occur like RTLS Manager software component is continuously restarting, inform Sewio about it via Service Desk.