Device Care Dashboard
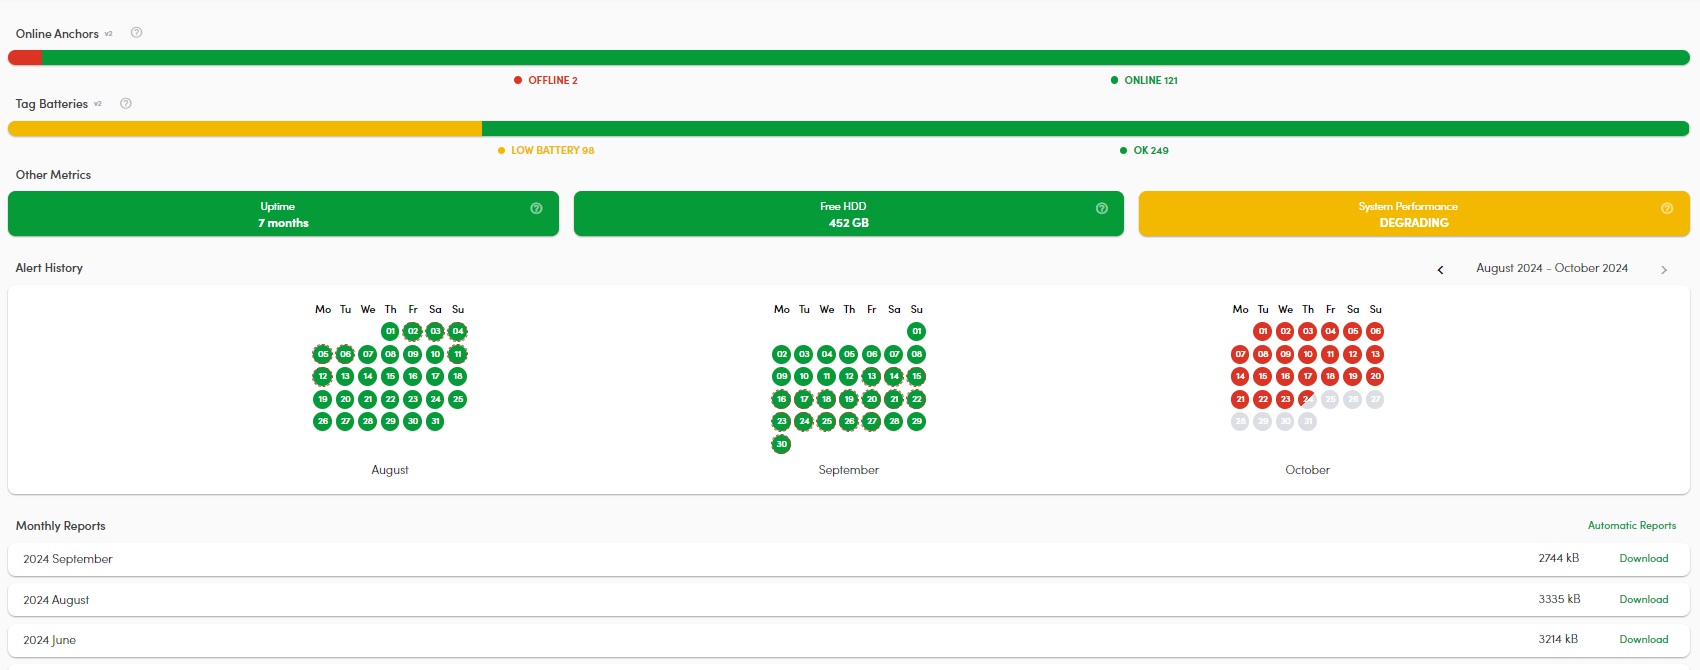
The dashboard provides a comprehensive view of your RTLS system's performance, covering key aspects related to both localization and hardware health. This overview helps you quickly assess the current status and performance of your system.
The dashboard allows you to monitor the performance and health of your RTLS system in real-time, offering an immediate insights into issues such as anchor connectivity, tag battery levels, system uptime, and any overall system performance, helping you to take proactive measures to maintain optimal system performance.
if you want to learn more about each metric that Device Care monitors, visit the Device Care Settings section, where all metrics are explained and can also be managed.
Alert History Calendar
This section of the dashboard presents an interactive calendar view that tracks daily system alerts. Each day is visually represented by one of three states, providing a clear overview of the system's alert history over the past three months:
No Alerts
- If no alerts occurred or persisted during the day, that day is displayed as a solid green circle. This indicates that the system operated without issues on that day.
Alerts
- When one or more alerts have occurred and is still persisting throughout the day, the day is marked with a solid red circle. These red days signal that attention is needed to resolve the ongoing issues within the system.
Solved Alerts
- If there were alerts during the day and the issue was resolved, but the issue was resolved, the calendar shows the day as a green circle with a red-dotted edge. This indicates that while alerts were triggered, the situation was addressed and resolved within the day.
This visual representation helps users quickly assess the health of the system over time and track the resolution of issues. It’s an efficient way to monitor both current and past system performance at a glance.
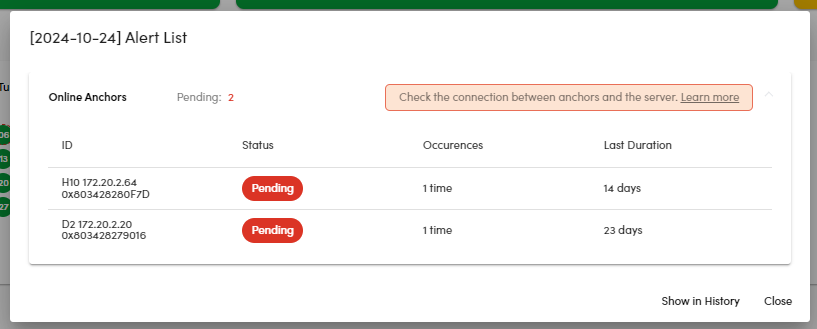
Click on a specific day and see the details of the alert(s).
Monthly Reports
Use the Download button to download a PDF report for the previous month. By clicking the Automatic Reports button, you will be redirected to the Device Care Settings, where you can configure which metrics should be included in the reports you receive by email.
Reports on the dashboard are generated monthly. Users can choose to subscribe to receive these reports via email on a weekly or monthly basis. For more information about reports, refer to the Device Care_v1 Reports page


