Extended Position Information Feature
RTLS system allows you to visualize extended position information for a particular tag. Enabling this feature will increase the amount of data presented in Sensmap (for example data on currently used master anchor, slaves anchors, visualization of hyperbolas, information about the signal quality of the received blink message). The "Extended Position Information" feature may help you to optimize positioning performance.
The smaller the hyperbolas intersection area the better confidence in positioning.
A profiler is a strong tool for debugging your critical areas. In this guide Troubleshooting and Tips, we will walk you through the process of using hyperbolas to detect errors in your installation.
Allowing Profiler
In order to use the Profiler, the extended position data sending must be enabled in the RTLS Manager. This will add information about currently used masters, slaves, and the quality of the calculated position to the received data streams.
1.) Navigate to the RTLS Manager.
2.) Go to RTLS Server Settings section.
3.) Expand the Logs tab.
4.) Set Extended Position Information to Yes.
5.) Press APPLY AND RESTART RTLS SERVER button.
6.) Wait until the RTLS Server is restarted.
Profiler Controls
To start profiling one of your tags follow these steps:
- Navigate to Profiler menu tab.
- Expand Extended Position Information section.
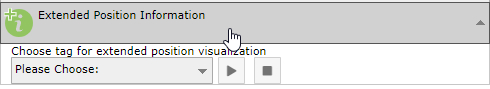
- Select the tag you would like to use for profiling.
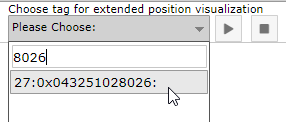
- Once the tag is selected you will see it's profiling information.

- To pause the tag's movement and analyze it's current values press the PAUSE button.
- To stop profiling current tag select a new one from the list or press the STOP button.
Legend
- dark green anchor - current master, no recalculation was needed;
- light green anchor - slave anchor, no recalculation was needed;
- dark red anchor - current master, recalculation was needed (some of the anchors has been removed from the calculation);
- light red anchor - current slave, recalculation was needed;
- blue curve - the calculated distance (hyperbola) between two anchors (anchor addresses/aliases are shown on mouse hover);