Appendix Long Term Barometrics Measurements
- Three Tags barometer drift for 15 days

Figure 1 Three tags from 15 days test, note: A5-2 (orange) has inverse trends with respect to A5-1 and A5-3. (y height [meters], x time [date])
- Pressure Sensor Drift – Anchor’s measurement
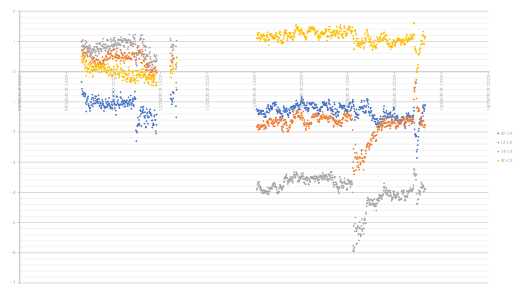
Figure 2 Barometric drift measurement (y - meters, x - time)
Test in lab, 5 anchors attached to the roof at the same height, resulting difference of pressures referencing to anchor C8, the anchors were not recalibrated, since the start on 9.8.2018 – note significant change of Pressure when the anchors were again connected to the RTLS system on 11.8.2018 after 12pm, we can also observe reaction of pressure on some of the anchors once sudden change of temperature occurred in the laboratory around
- Absolute barometer values vs. altitude, link.
- Pressure values in Brno within 14 days.

Z-Axis based on Barometer Practical Considerations
- Since barometer measure atmospheric pressure Tag cannot be placed in hermetic enclosure like IP67.
- Sudden atmospheric pressure changes such as fast door close may cause short jumps of Tag within Z-axis value. This is typically compensated thanks to static Anchors with barometer and known Z-axis value.
- Tags going from outdoors to indoors require some time to stabilization.
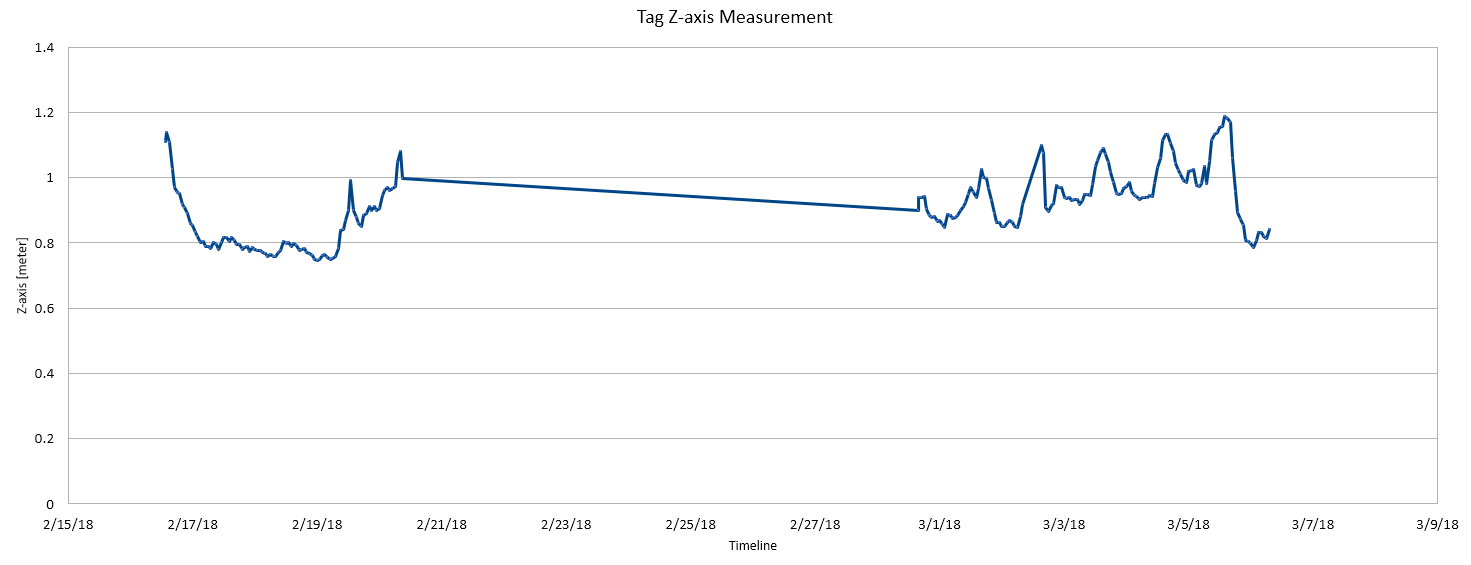
- On a graph below Z-axis value is shown during the weekend. Tag position was static within a building. Initial drift within 0.5m and Z-axis variation within 20cm is noticeable.
Graph Z-axis is timeline, Graph Y-axis is Z-axis measurement in meters.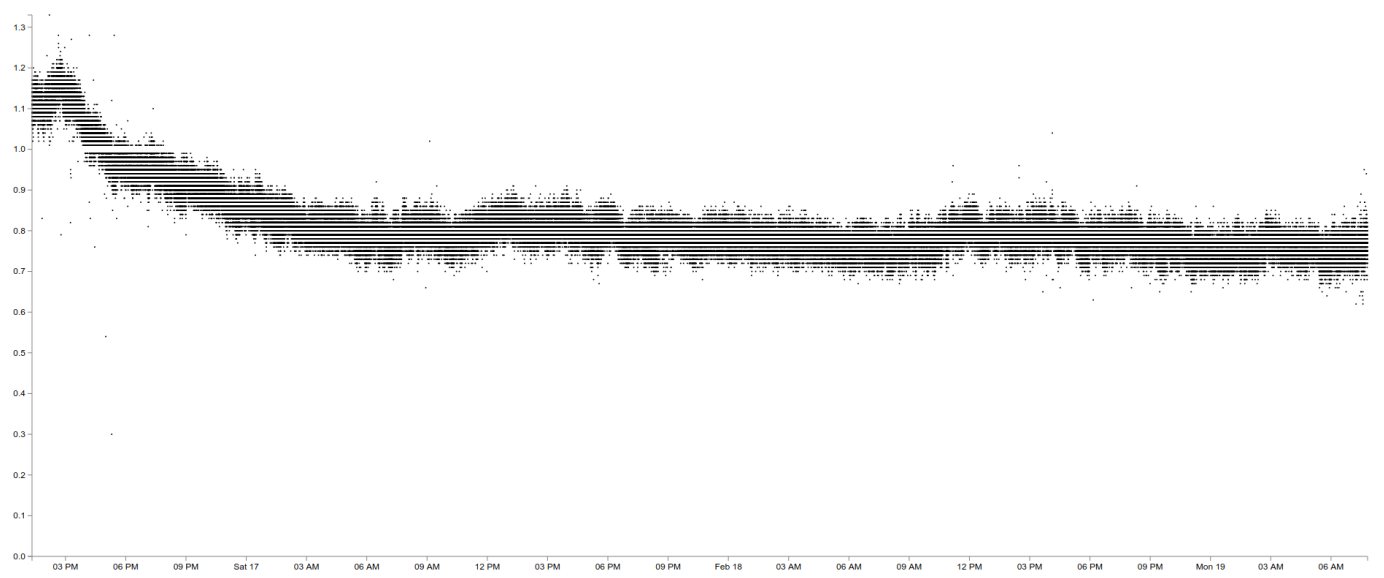
- Graph below shows stability of static Tag on Z-axis during the one month period.